LLOYDS AFFORDABILITY REVIEW
Gap between house prices and earnings narrows – but higher borrowing costs limit affordability gains
- UK’s house price to income ratio falls from 7.6 to 7.3, an 11-year low, as earnings continue to outpace house price growth
- For first-time buyers, homes now cost less than six times earnings, falling from 6.1 to 5.9
- However, monthly mortgage costs have increased by £57 over the last year due to higher interest rates, while saving for a deposit remains a big hurdle for many buyers
- Traditionally least affordable regions record some of the largest improvements in house price to income ratio, although London and the South East remain the most expensive places to buy
- Scotland and northern England feature many of Britain's most affordable local authorities, led by Inverclyde and Aberdeen
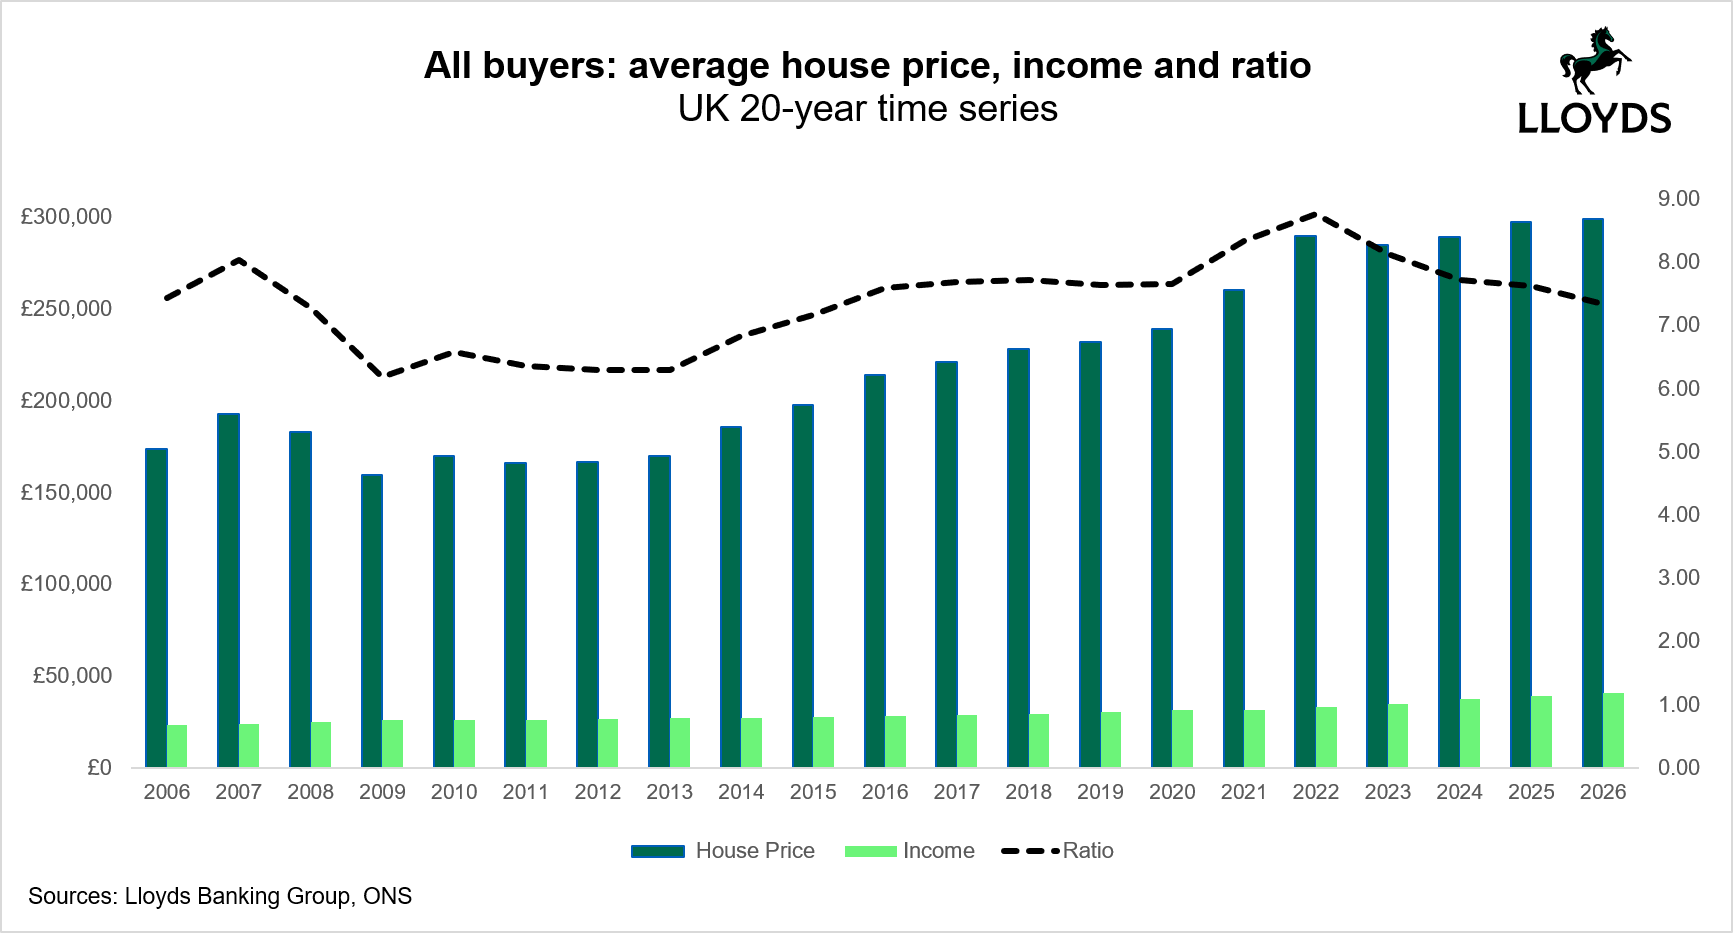
The average UK home now costs the equivalent of 7.3 times average earnings, down from 7.6 a year ago, according to new research from Lloyds, the UK's biggest mortgage lender. The ratio is now at its lowest level since 2015.
Nationally, the average property price increased by +0.5% over the last year, to £299,131, while average earnings rose by +4.5% to £40,790, narrowing the gap between average house prices and earnings.
However, while house prices have become more affordable compared to earnings, higher interest rates mean average monthly mortgage repayments have increased over the last year, rising from £1,100 to £1,157.
Andrew Asaam, Mortgages Director at Lloyds, said:
"There are some encouraging signs for people looking to buy a home. Wages have continued to rise while house prices have remained relatively stable, helping to narrow the gap between earnings and house prices.
"However, affordability remains stretched for many households. Mortgage rates are higher than they were a year ago and saving for a deposit continues to be one of the biggest barriers facing first-time buyers.
"Buyers may have more options than they realise, including mortgages designed for those with smaller deposits. While these won't be right for everyone, they can help some buyers take their first step onto the housing ladder sooner."
First-time buyer homes now cost less than six times earnings
For first-time buyers, the typical property price was broadly stable over the last year, rising by just 0.3% from £238,875 to £239,681. With earnings growth outpacing house price inflation, the house price to earnings ratio for a first home fell from 6.1 to 5.9 – the lowest since 2015.
However, saving for a deposit remains a key challenge. A typical first-time buyer still needs to save almost £24,000 for a 10% deposit, highlighting why it remains one of the biggest barriers to homeownership. This has seen lenders introduce more low-deposit options, including Lloyds’ £5k deposit mortgage, helping to reduce the amount required upfront.
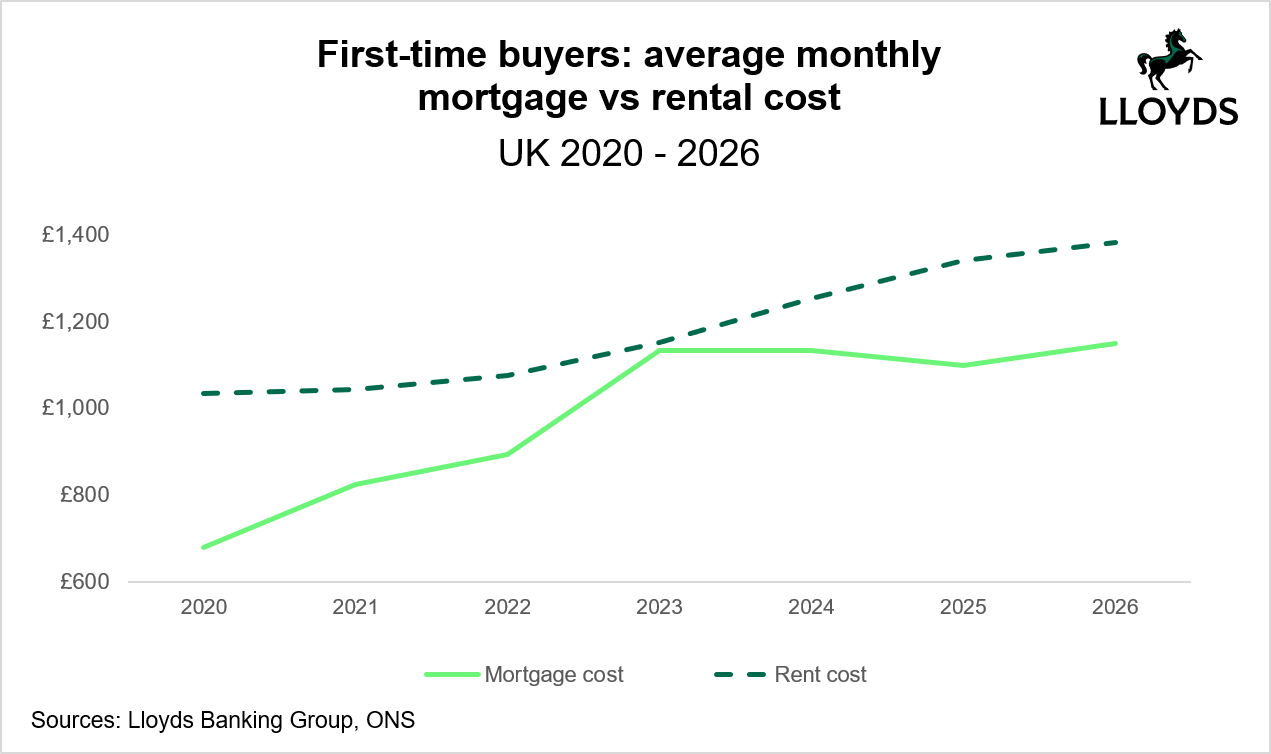
Higher borrowing costs are also an important consideration for first-time buyers, with average monthly repayments rising from £1,100 to £1,150 over the last year. But wage growth means that mortgage costs still account for the same proportion of income compared to last year, amounting to 34% of average monthly pay.
For those able to save a deposit, mortgage repayments are often still lower than the equivalent rental costs, with the average monthly rent rising by +3.2% to £1,382, up from £1,339 last year. The average first-time buyer mortgage payment now accounts for around 34% of income, compared with 41% for those renting.
House prices become more affordable in priciest areas
The gap between Britain’s most and least affordable housing markets has also narrowed slightly over the last year, with the biggest improvements in affordability generally seen in regions where house prices were most expensive relative to earnings.
The South East recorded the largest improvement, with the average home now costing 9.1 times earnings, down from 9.7 a year ago. Greater London followed, falling from 10.9 to 10.3, while Eastern England improved from 8.7 to 8.2 and the South West from 8.2 to 7.7. Despite these improvements, London and the South East remain the two least affordable regions.
By comparison, regions and nations with lower house price to earnings ratios generally saw less movement. The ratio fell from 5.1 to 5.0 in the North East, while Scotland remained broadly unchanged at 5.3. In the North West, it fell from 6.5 to 6.3, while Yorkshire and the Humber reduced from 6.0 to 5.8.
Northern Ireland was the only nation or region where house prices became less affordable relative to earnings. House prices rose by +7.4% compared to a +3.7% rise in earnings, causing the price to earnings ratio to increase from 5.8 to 6.0.
Where buyers can get the most for their money
At a local authority level, significant differences in house price affordability remain across Britain, with many of the lowest house price to earnings ratios found in Scotland and northern England, highlighting where buyers may be able to get more for their money.
Inverclyde and Aberdeen (Scotland) are Britain’s most affordable local authorities, with the average home costing 3.5 times earnings in both areas. They are followed by Kingston upon Hull (Yorkshire and the Humber), Blackpool (North West) and Dundee (Scotland), where homes cost 3.6 times earnings.
At the other end of the scale, Elmbridge in Surrey (South East) remains Britain’s least affordable local authority with a house price-to-income ratio of 17.4. Kensington and Chelsea (London) follows at 17.3, while St Albans (Eastern England) ranks third at 14.1.
The local data provides further evidence of some narrowing between Britain’s most and least affordable housing markets. Several traditionally expensive areas recorded some of the largest improvements in affordability, including Westminster (London), where the ratio fell from 15.2 to 13.3; Cambridge (Eastern England), from 11.4 to 10.0; Elmbridge (South East), from 18.7 to 17.4; and New Forest (South East), from 10.1 to 8.7.
Conversely, several more affordable areas saw their ratios increase. Rossendale (North West) recorded the largest increase from 4.8 to 5.4, while Wrexham (Wales) increased from 4.9 to 5.5 and Halton (North West) from 5.1 to 5.6. Argyll and Bute (Scotland) rose from 4.6 to 5.2, while Chesterfield (East Midlands) rose from 5.2 to 5.8.
Andrew continues:
"Where you buy continues to make a huge difference to affordability. Our recent research showed homebuyers can save 28% on average by looking just next door to the UK’s priciest postcodes.
"For first-time buyers in particular, a small shift in location could make a big difference – not just in getting on the ladder, but in what kind of property is within reach.
"Many parts of Scotland and northern England continue to offer some of the best value relative to local earnings. For buyers with flexibility over where they live, that can make a meaningful difference to what they can afford."
Published: 02 October 2026


